“If I could only get a glimpse of what they are actually learning, that would make such a difference,” a senior Business School instructor once said to me. This wishful thought is common for educators, trainers and facilitators of corporate learning, especially online. However, the imaginary “brain scan” is becoming almost second nature in online classrooms, when using the right tools.
Technology that was built for learning makes it possible to track the learning journey. Aspects of student learning such as engagement, student performance, peer interactions and knowledge retention can now be visualized in a dashboard. One can gain insights into learner behavior, paving the way for tailored educational experiences. In this post, I would like to suggest a few practical examples and guidelines for how you can achieve learning success and improve teaching with data.
Increase Engagement With Active Learning
Leveraging data for learning can significantly increase learners' engagement and facilitate more active learning environments. Engagement data provides early indicators of risk, allowing instructors to intervene effectively and keep learners on track. Planning intentional interventions based on learning analytics can also boost retention rates and help learners retain new knowledge.
An impact study conducted by the University of Southern Queensland showed that students tend to lose focus and disengage in traditional lecture-based classes. Based on these findings, the university changed its teaching delivery method to include more active learning components.
The academic staff adopted Engageli’s active learning platform, and incorporated small-group discussions around virtual tables to boost student engagement. Table-based activities helped learners deepen their understanding of the content by actively discussing it with their peers.
-2.png?width=764&height=386&name=image%20(1)-2.png) The chart above shows the speaking time trends throughout the class session. When a small-group discussion was introduced using Engageli’s virtual tables, the engagement levels went up significantly.
The chart above shows the speaking time trends throughout the class session. When a small-group discussion was introduced using Engageli’s virtual tables, the engagement levels went up significantly.
-3.png?width=370&height=373&name=image%20(2)-3.png)
In addition to small group discussions, the university added interactive polls, whiteboards, collaborative documents, and additional collaborative learning activities. These led to a 30% increase in learner engagement in just a few classes compared to more passive content delivery methods.
The chart shows aggregate student speaking time over a period of several weeks. During that period, the staff gradually added active learning components. These corresponded with a significant increase in engagement, and specifically in student speaking time.
Identify and Support Students at Risk with Targeted Interventions
-2.png?width=435&height=435&name=image%20(3)-2.png)
The potential of data-driven teaching to enhance online education is immense. By focusing on real-time engagement data, instructors can ensure that every learner has the opportunity to succeed.
Engageli’s platform enables identifying struggling learners and better supporting them with interventions. As a Learning Scientist from University of North Texas told us, the real-time green engagement indicators allow her to instantly view students' activity and engagement levels. Based on this data, Instructors can adapt their teaching strategies to better meet the needs of their learners.
-Mar-12-2025-04-47-38-5927-PM.png?width=636&height=370&name=image%20(4)-Mar-12-2025-04-47-38-5927-PM.png)
Gain a Richer View of Attendance and Participation
Many organizations prioritize attendance as their main data point for progress tracking. But, sometimes attendance only paints a partial picture.
The University of Southern Queensland tracks attendance data for both live online sessions and asynchronous learning, in which students typically interact with session recordings. The data showed that students spend more time watching recorded sessions as compared to attending them live. In some cases, the asynchronous option was the main learning method. By understanding and acting on this insight, the academic staff made an effort to design meaningful asynchronous learning journeys to support their students. -2.png?width=782&height=438&name=image%20(5)-2.png)
**The chart above shows that students spent more time in the asynchronous environment as compared to the live classes.
Encourage and Track Diverse Participation Channels
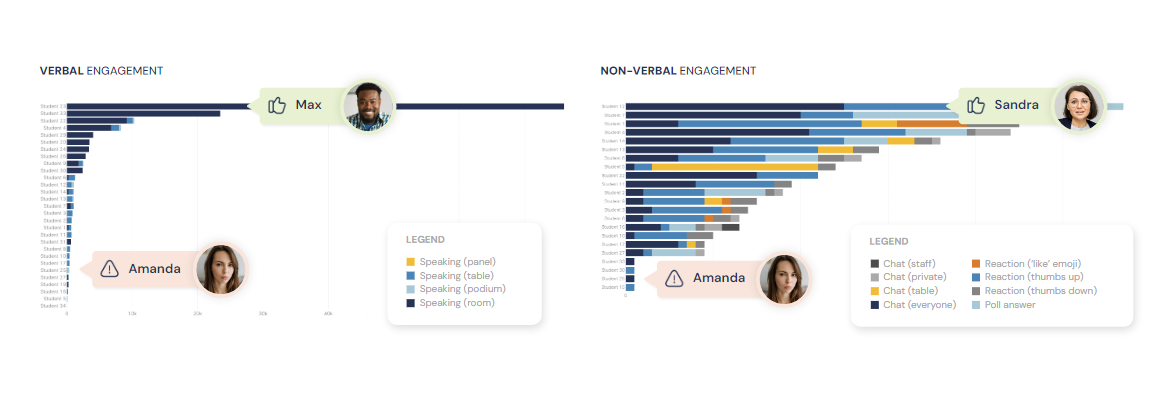
At a leading Business School in Australia, engagement analytics shifted their perception of engagement and participation in online classes. It is common to refer to speaking time as an indication of engagement. However, not all learners feel comfortable to raise their hand and speak to the class. That does not necessarily mean they are disengaged. Some will feel comfortable asking a question, others will take notes, use the chat, Q&A forum, reactions, or share a collaborative document with their peers.
Shifting the focus from speaking metrics to a more diverse set of participation channels, will enable more students to be visibly recognized for their engagement.
** The chart below compares speaking time with non-verbal engagement levels. Each chart has different students at the top of the leaderboard, highlighting how different learners can actively participate using a variety of channels.
-3.png?width=817&height=231&name=image%20(6)-3.png)
Take Your Online Classroom to the Next Level
By leveraging meaningful learning metrics, you can improve outcomes and optimize resources to better support learners. If you are looking to delve deeper into how data can revolutionize your educational strategies, contact Engageli. Let us explore how you can implement these insights and foster a more engaging and successful learning environment.